

Per Capita Electricity by State, 2024-25
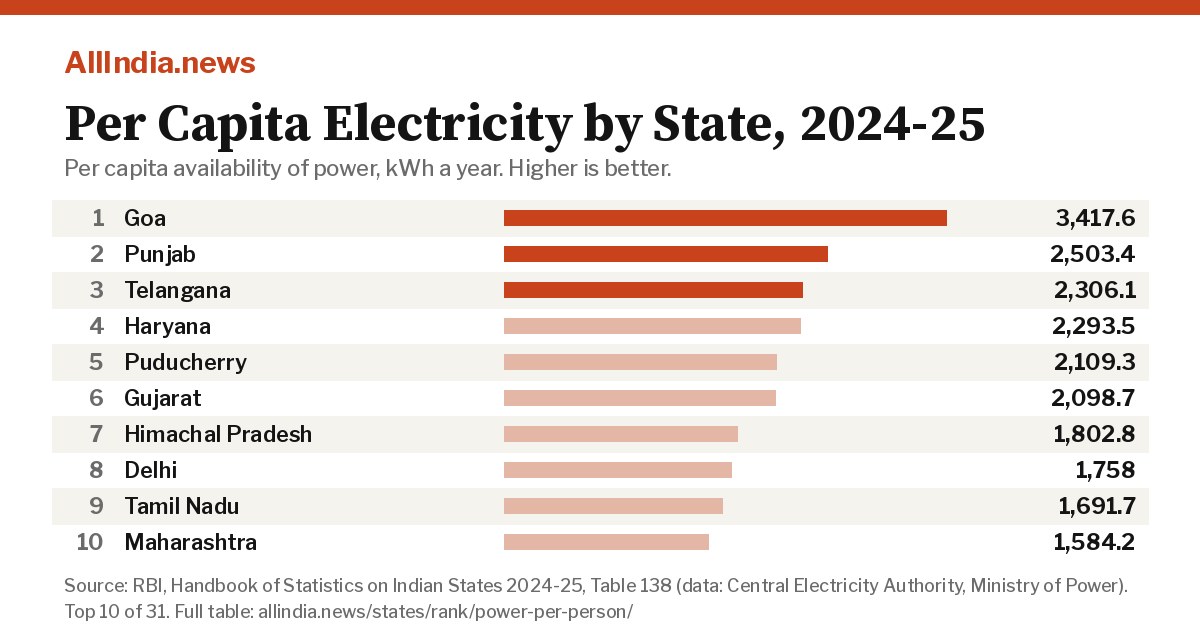
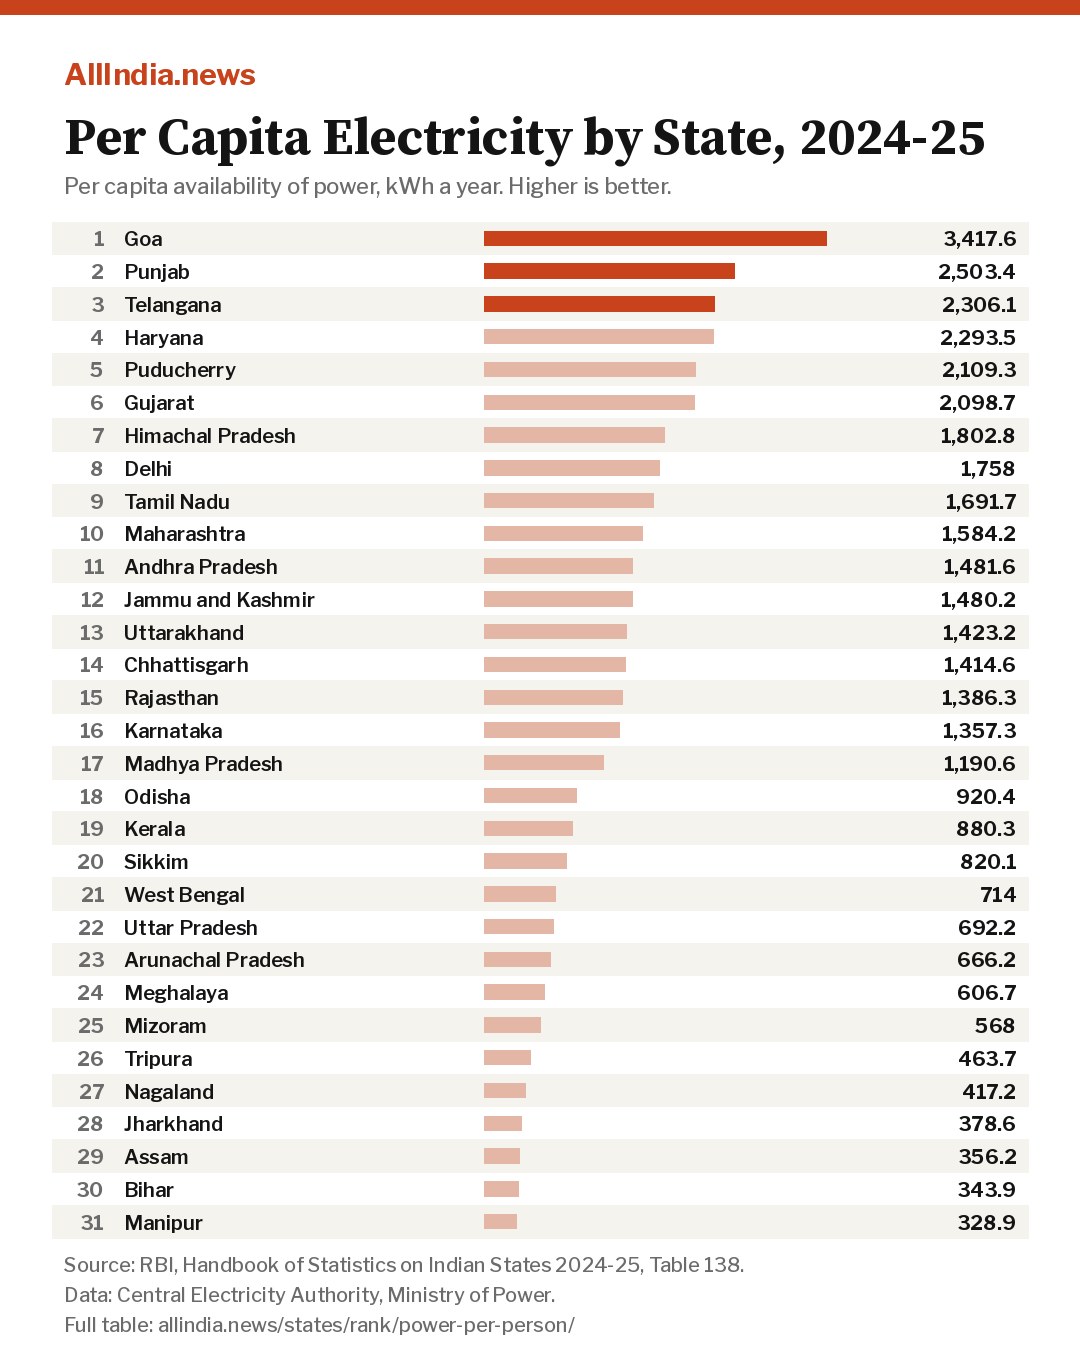
Per capita availability of power, kWh a year, 2024-25: 31 states and union territories ranked, higher is better. The all India figure is 1,208.2 kWh.
Source: RBI Handbook, Table 138 (data: Central Electricity Authority, Ministry of Power).
| Rank | State | Electricity per person |
|---|---|---|
| 1 | Goa | 3,417.6 kWh |
| 2 | Punjab | 2,503.4 kWh |
| 3 | Telangana | 2,306.1 kWh |
| 4 | Haryana | 2,293.5 kWh |
| 5 | Puducherry | 2,109.3 kWh |
| 6 | Gujarat | 2,098.7 kWh |
| 7 | Himachal Pradesh | 1,802.8 kWh |
| 8 | Delhi | 1,758 kWh |
| 9 | Tamil Nadu | 1,691.7 kWh |
| 10 | Maharashtra | 1,584.2 kWh |
| 11 | Andhra Pradesh | 1,481.6 kWh |
| 12 | Jammu and Kashmir | 1,480.2 kWh |
| 13 | Uttarakhand | 1,423.2 kWh |
| 14 | Chhattisgarh | 1,414.6 kWh |
| 15 | Rajasthan | 1,386.3 kWh |
| 16 | Karnataka | 1,357.3 kWh |
| 17 | Madhya Pradesh | 1,190.6 kWh |
| 18 | Odisha | 920.4 kWh |
| 19 | Kerala | 880.3 kWh |
| 20 | Sikkim | 820.1 kWh |
| 21 | West Bengal | 714 kWh |
| 22 | Uttar Pradesh | 692.2 kWh |
| 23 | Arunachal Pradesh | 666.2 kWh |
| 24 | Meghalaya | 606.7 kWh |
| 25 | Mizoram | 568 kWh |
| 26 | Tripura | 463.7 kWh |
| 27 | Nagaland | 417.2 kWh |
| 28 | Jharkhand | 378.6 kWh |
| 29 | Assam | 356.2 kWh |
| 30 | Bihar | 343.9 kWh |
| 31 | Manipur | 328.9 kWh |
Equal figures share a rank.
Download image (1200 x 630)For WhatsApp and Instagram (1080 x 1350)
Other rankings
Where the figures come from
Every figure is copied from the Reserve Bank of India Handbook of Statistics on Indian States 2024-25, released on 11 December 2025, which brings together data published by government agencies. Each measure below names the agency that collected it and the period it covers. AllIndia.news does not estimate or adjust any figure. The comparison covers the 28 states and three union territories with their own legislature (Delhi, Jammu and Kashmir and Puducherry); the other union territories are left out because several of these tables have no figures for them.
- Per capita income: Per capita net state domestic product at current prices, rupees, 2022-23. Source: RBI Handbook, Table 19 (data: National Statistical Office (NSO), MoSPI). 2022-23 is the latest year with a figure for every state in this table (Gujarat has none for later years).
- Real GSDP growth: Growth of gross state domestic product at constant (2011-12) prices, per cent, 2022-23. Source: RBI Handbook, Table 22 (data: National Statistical Office (NSO), MoSPI). Worked out by AllIndia.news from the table: GSDP at constant prices in 2022-23 compared with 2021-22. 2022-23 is the latest year with a figure for every state.
- Infant mortality rate: Infant deaths per 1,000 live births, per 1,000 live births, 2023. Source: RBI Handbook, Table 4 (data: Sample Registration System, Office of the Registrar General of India).
- Urban unemployment rate: Unemployment rate in towns and cities, usual status (adjusted), all persons, per cent, 2023-24. Source: RBI Handbook, Table 9 (data: Periodic Labour Force Survey (PLFS), NSO, MoSPI). The table gives the rate per 1,000 people in the labour force; shown here per 100 (per cent).
- SDG India Index score: NITI Aayog SDG India Index composite score, out of 100, 2023. Source: RBI Handbook, Table 106 (data: NITI Aayog).
- Multidimensional poverty: Share of people who are multidimensionally poor (National MPI headcount ratio), per cent of people, 2019-21. Source: RBI Handbook, Table 10 (data: NITI Aayog, National Multidimensional Poverty Index: A Progress Review 2023). Based on the National Family Health Survey (NFHS-5), 2019-21.
- Electricity per person: Per capita availability of power, kWh a year, 2024-25. Source: RBI Handbook, Table 138 (data: Central Electricity Authority, Ministry of Power).
- Secondary school enrolment: Gross enrolment ratio, secondary (classes 9 to 12), all children, per cent, 2024-25. Source: RBI Handbook, Table 1 (data: UDISE+ 2024-25, Ministry of Education). Gross enrolment ratio: everyone enrolled in classes 9 to 12, of any age, as a share of children of that age group, so it can pass 100.
Equal figures share a rank. Found an error? Tell us from the contact page.